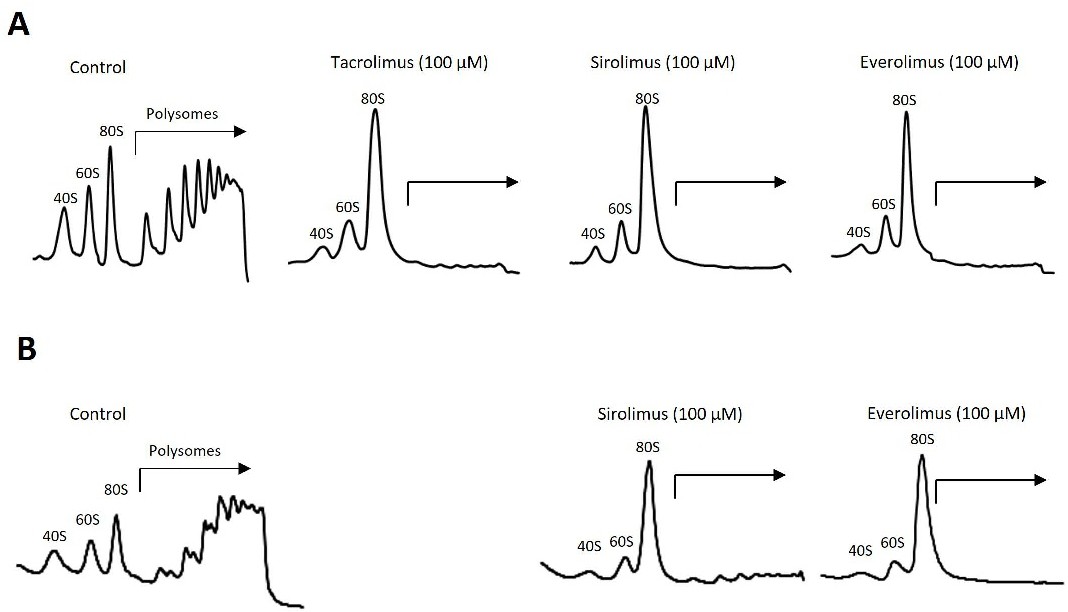
Fig. 4. Polysome profile in Tacrolimus-, Sirolimus- and Everolimus-treated HepG2 (A) and Huh7 (B) cells. Treatments were administered at 100 µM. Polysome profiles (12 h) were obtained following the procedure described in Material and Methods. No polysome profile was observed in Tacrolimus-treated Huh7 cells. Results are expressed as mean ± SEM of three to four independent experiments.